
What actually moves broiler FCR — and what just moves the average
Feed conversion ratio is the most quoted number in broiler production and one of the most misread. Two flocks can close at an identical FCR and tell opposite stories — one converted well, the other simply lost its worst birds early enough to flatter the average. Reading FCR correctly means knowing which levers actually move conversion, and which arithmetic artifacts merely move the number.
The levers that actually move conversion
Feed form and mill quality. Birds spend energy eating. Poor pellet quality — high fines, inconsistent durability — means more pecking per gram ingested, and conversion pays for it. If your mill records pellet durability by batch and your houses record which batches they received, this stops being a theory and becomes a report.
The first week. Brooding temperature and early feed access set the intestinal development that every later gram of feed depends on. A flock that starts poorly converts poorly for life — seven-day weight remains one of the most predictive numbers you will ever record.
Water. Consumption drops precede feed problems, often by days. A house where water-to-feed ratio drifts is telling you something no closeout report will: check drinker height, pressure, and flow before the weights move.
Health challenges. Subclinical disease taxes conversion silently — energy spent on immune response is energy not spent on growth. This is where lab results attached to the flock, rather than filed in a drawer, earn their keep.
Harvest timing. Conversion worsens with age as maintenance requirements grow. Days added past target weight are among the most expensive days in the cycle — which is why harvest planning against projected weights, not calendar habit, shows up directly in the plant-weighted FCR.
The math that hides problems
Plain FCR divides total feed by total live weight sold. Birds that die late in the cycle ate almost a full bird’s worth of feed but sold nothing — yet plain FCR spreads their feed over the survivors and can still look respectable.
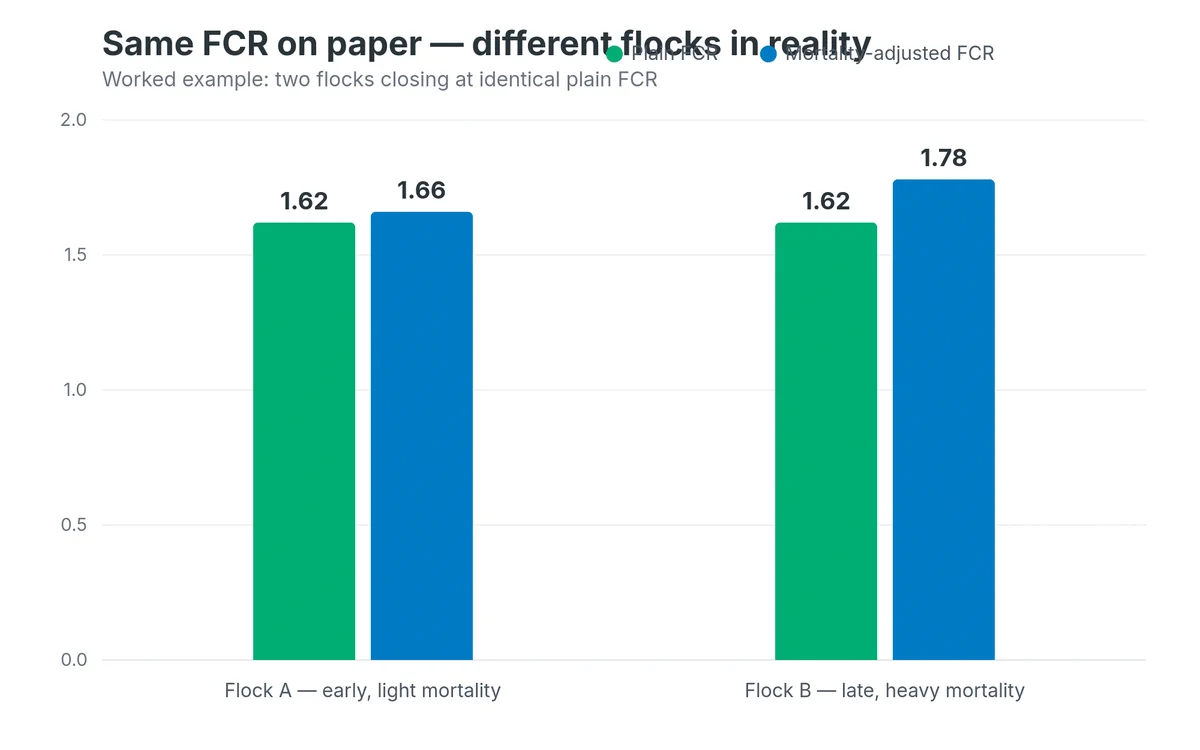
That is why serious benchmarking uses a mortality-adjusted FCR — correcting for when birds died, not just how many. In the worked example above, Flock B looks equal on paper and is materially worse in reality: its mortality came late and expensive. Benchmark houses on adjusted numbers first, then compare.
Catch the drift while the flock is still in the house
The second habit that separates data-driven operations: plotting daily weights against the breed-standard curve instead of waiting for closeout. Drift announces itself weeks before the plant does.
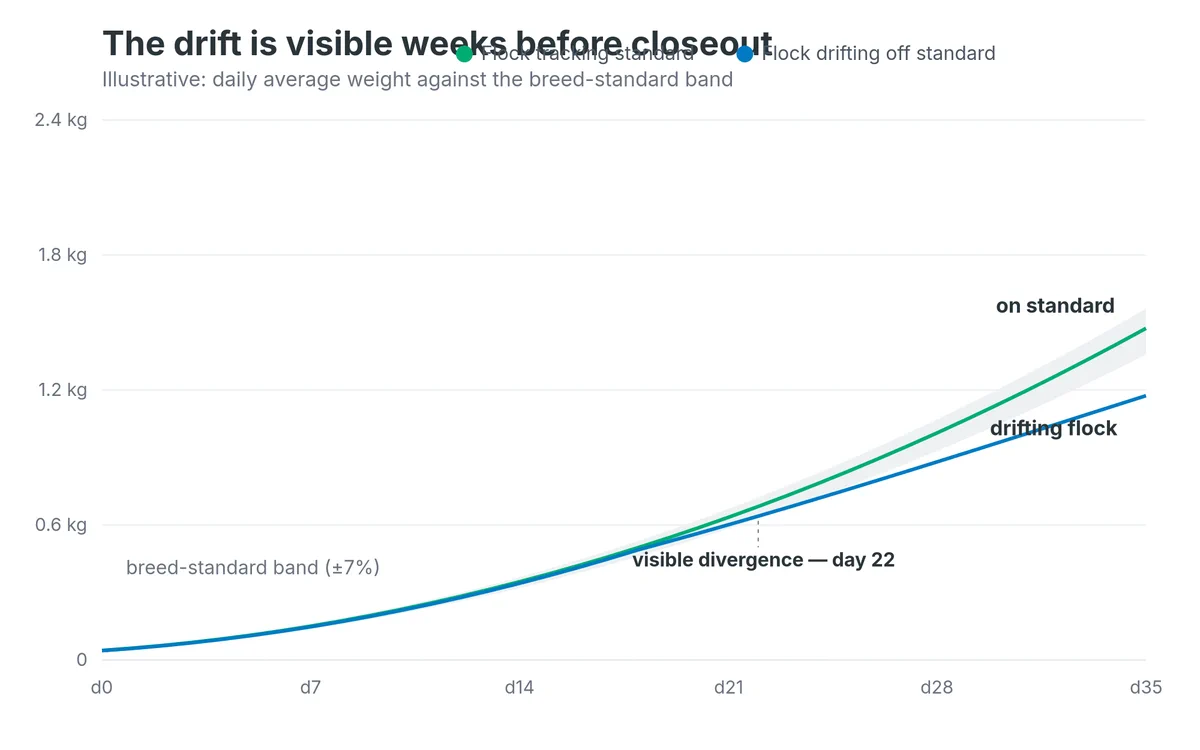
A flock leaving the band at day 22 is a management conversation with twelve days of leverage left. The same discovery at closeout is a variance explanation.
What to do with this on Monday
Three concrete habits, in ascending order of ambition: record seven-day weights religiously and treat them as a leading indicator; put water-to-feed ratio on the daily review, not the weekly one; and move your house-to-house benchmarking onto mortality-adjusted FCR so the arithmetic stops rewarding early death. None of these require new equipment — only that the numbers you already generate end up in one place, against the same standards.